
A Look at the California Electrical Grid Evolution –
I got interested in studying the California electric grid as the result of the passage of Measure UU. The amount of energy consumed by an aquatic facility is significant: in 2019 the existing pools used 25,396 therms of gas and 110 MWh of electricity a year, equivalent to 854 MWh (1MWh = 1,000 kwh). The new Piedmont aquatic facility is planned to have three times the surface and therefore could need as much as three times more energy in a steady state.
Clearly the new facility ought to minimize greenhouse gases (GHG) emissions. Given the expected lifetime of the future facility, it makes sense to look forward and consider its GHG footprint in the long term in the context of the evolution of the grid, the City Climate Action Plan and the State 2050 decarbonisation goals.
I built a simulation engine for the California grid based on the hourly empirical data available for the year 2019 from the Energy Information Agency (EIA) and the California Public Utility Commission. It simulates the way the energy available from various in-state and out-of-state sources are fed into the grid to meet demand. Increase in wind and solar supply is assumed to be based on scaling existing farms, therefore resulting in a proportional increase in such hourly energy offered to the grid. Demand is scaled based on the projection of the adoption of electric vehicles, the construction of new all-electric homes, and the conversion to electricity of residential, commercial, and industrial natural gas usage. Each sector has its own specific hourly demand distribution.
Wind and solar are energy sources with very large down and up swings.
-
On the down side in 2019 the wind and solar offering fell below 5% of hourly demand 19% of the time. Such intermittent power needs to be backfilled on a real time basis by dispatchable sources to match demand. Dispatchable energies are generated by power units able to vary output to follow demand, such as natural gas, hydroelectric, nuclear and geothermal plants. The utilisation factor of such traditional plants diminishes with intermittent energy use, but the plants cannot be decommissioned because their full power is needed for the several hours a year with high demand and lack of wind and sun.
-
On the up side, wind and solar energy production has to be curtailed whenever its hourly generation exceeds demand (minus a dispatchable energy floor to ensure reliable service). As the proportion of wind and solar power offered to the grid relative to demand increases, the proportion of such refused energy relative to the one offered increases.
The graph below is the result of running scenarios on the simulator corresponding to the projected demand in 2045. Note that the projection does not take into account converting industrial natural gas use (768,188 million cubic feet a year) to electricity, equivalent to 225 TWh a year assuming all industrial usage is for heating (one TWh equals 1,000,000 MWh).
The refused wind and solar energy could be converted to hydrogen through electrolysis rather than curtailed and used either to power hydrogen cars, to generate dispatchable electricity through hydrogen turbines and/or to be mixed with natural gas for distribution through the existing gas network. See below: 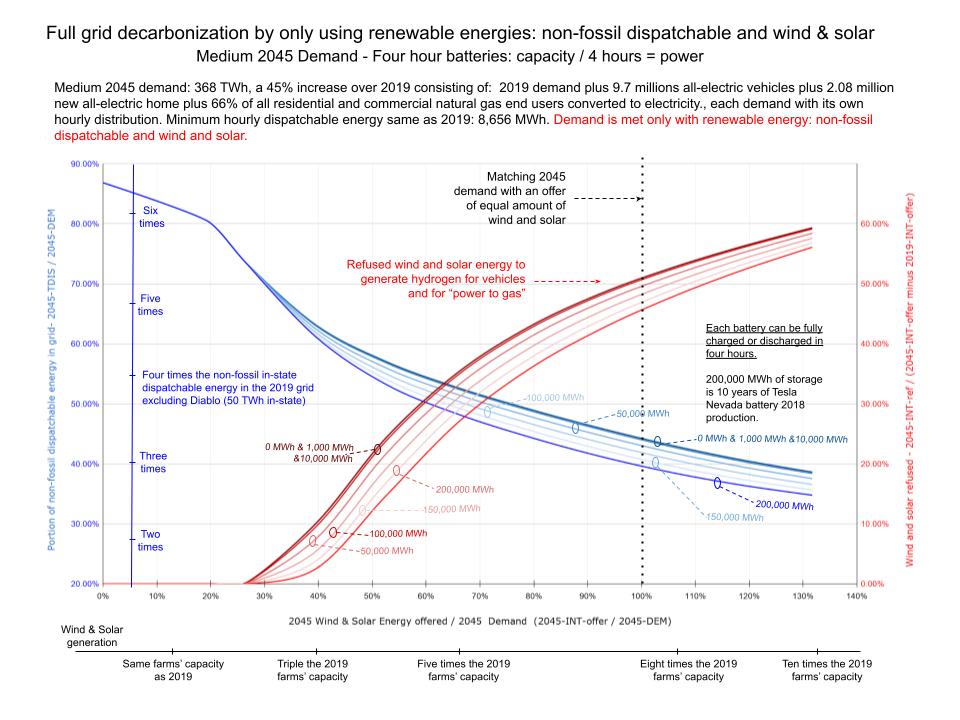 Looking at the various possible evolutions of the mix of energy sources in the grid, I was hoping to calculate the sweet spot on the blue lines in the chart for the ratio of wind and solar power offered relative to demand that would optimize all life cycle costs and service reliability. But I failed because of the large uncertainties on many parameters which would allow me to reach any conclusion that I am biased towards, in particular:
-
Cost of upgrading the natural gas distribution network to handle hydrogen.
-
Life cycle cost of new nuclear and hydrogen dispatchable power plants.
-
Life cycle cost of new solar and wind farms with potentially lower level of utilization than currently accounted for.
-
Life cycle cost of traditional power plants operated at much lower utilisation factor, but still needed to power the grid in the hours with no wind and solar.
-
Energy efficiency in the electricity-hydrogen- electricity life cycle.
-
Life cycle cost of batteries.
Politics will drive where the grid ends up. Currently intermittent energy sources are favored over dispatchable non-fossil power plants as they create jobs all over California rather than in a few places and have a projected low life cycle cost.
With regard to the design of the new aquatic facilities, I would favor a single smaller pool focused on sports rather than recreation because of my belief that frugality is essential to meet the climate challenge. In any case, I know that a competent team focused on sustainability is working on the design of a “green” pool and I am confident that the promises of Measure UU will be achieved to the satisfaction of our community.
Bernard Pech, Piedmont Resident